Running the DELPHI event display
The DELPHI event display, also known as DELGRA, is used to visualise reconstructed events. It allows to view events as they turn up in the detector, examine tracks, identify jets and much more. This document gives a brief introduction on how to start up this tool.
Important note: The event display only works on reconstructed data, not on raw data.
Directory structure
DELGRA expects to see a folder called graexe in your home directory, with 4 subfolders in it:
- graexe/data: Default folder for reconstructed date files which are to be scanned.
- graexe/hcopy: DELGRA allows to print the current view into a file. This is where the output of these screenshots will go.
- graexe/macro: Folder for macros.
- graexe/run: This folder contains log files from running the program. Consult it in case the program does not work correctly or crashed.
In case it does not find the top folder graexe, it will try to create the full tree.
Requirements
The display requires X11, Motif, OpenGL and GLEW run time libraries, as well as xorg-x11-fonts in 100 dpi and 75 dpi font packages. It works best with OpenGL hardware accelleration.
Starting the event display
The event display consists of a set of different executables which communicate with each other. You can start the event display from a shell from your home directory:
cd
rungra
It should start up showing an hour glass and a welcome box, like this:
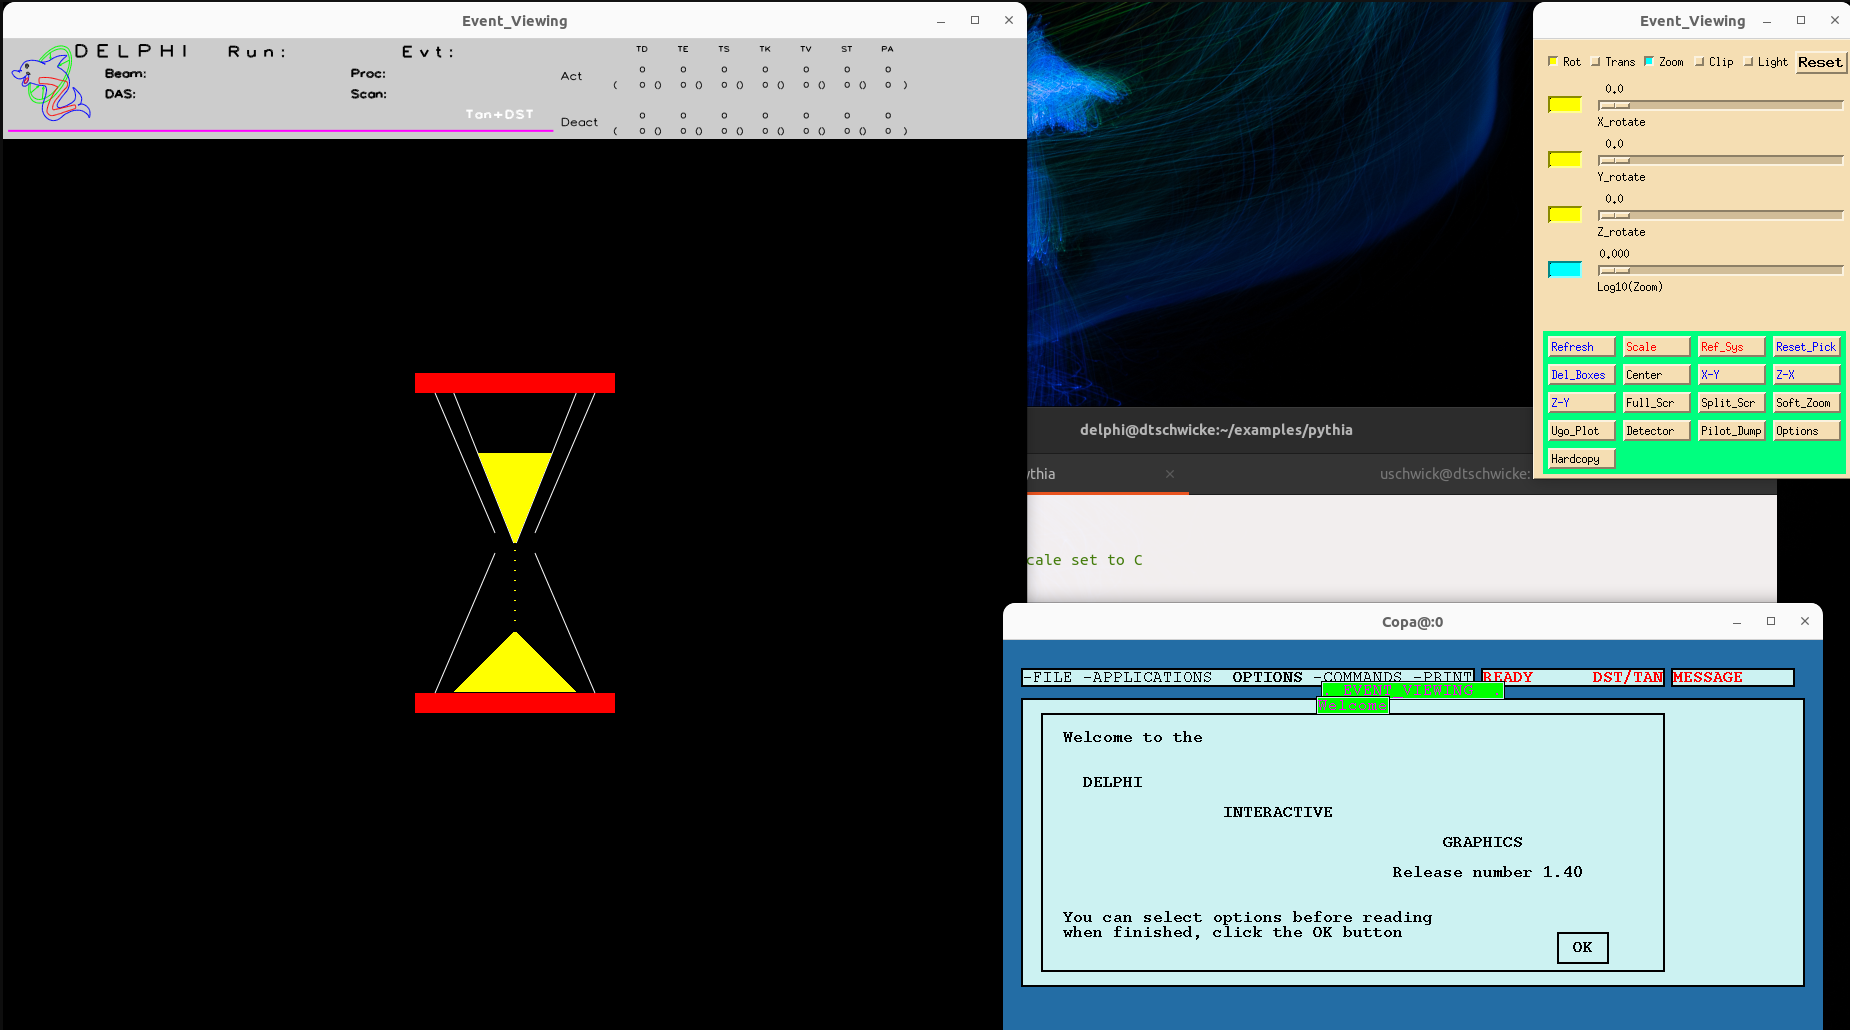
After pressing on OK in the welcome box, the program will bring up the file dialog where you can select the folder and the file to be read in:
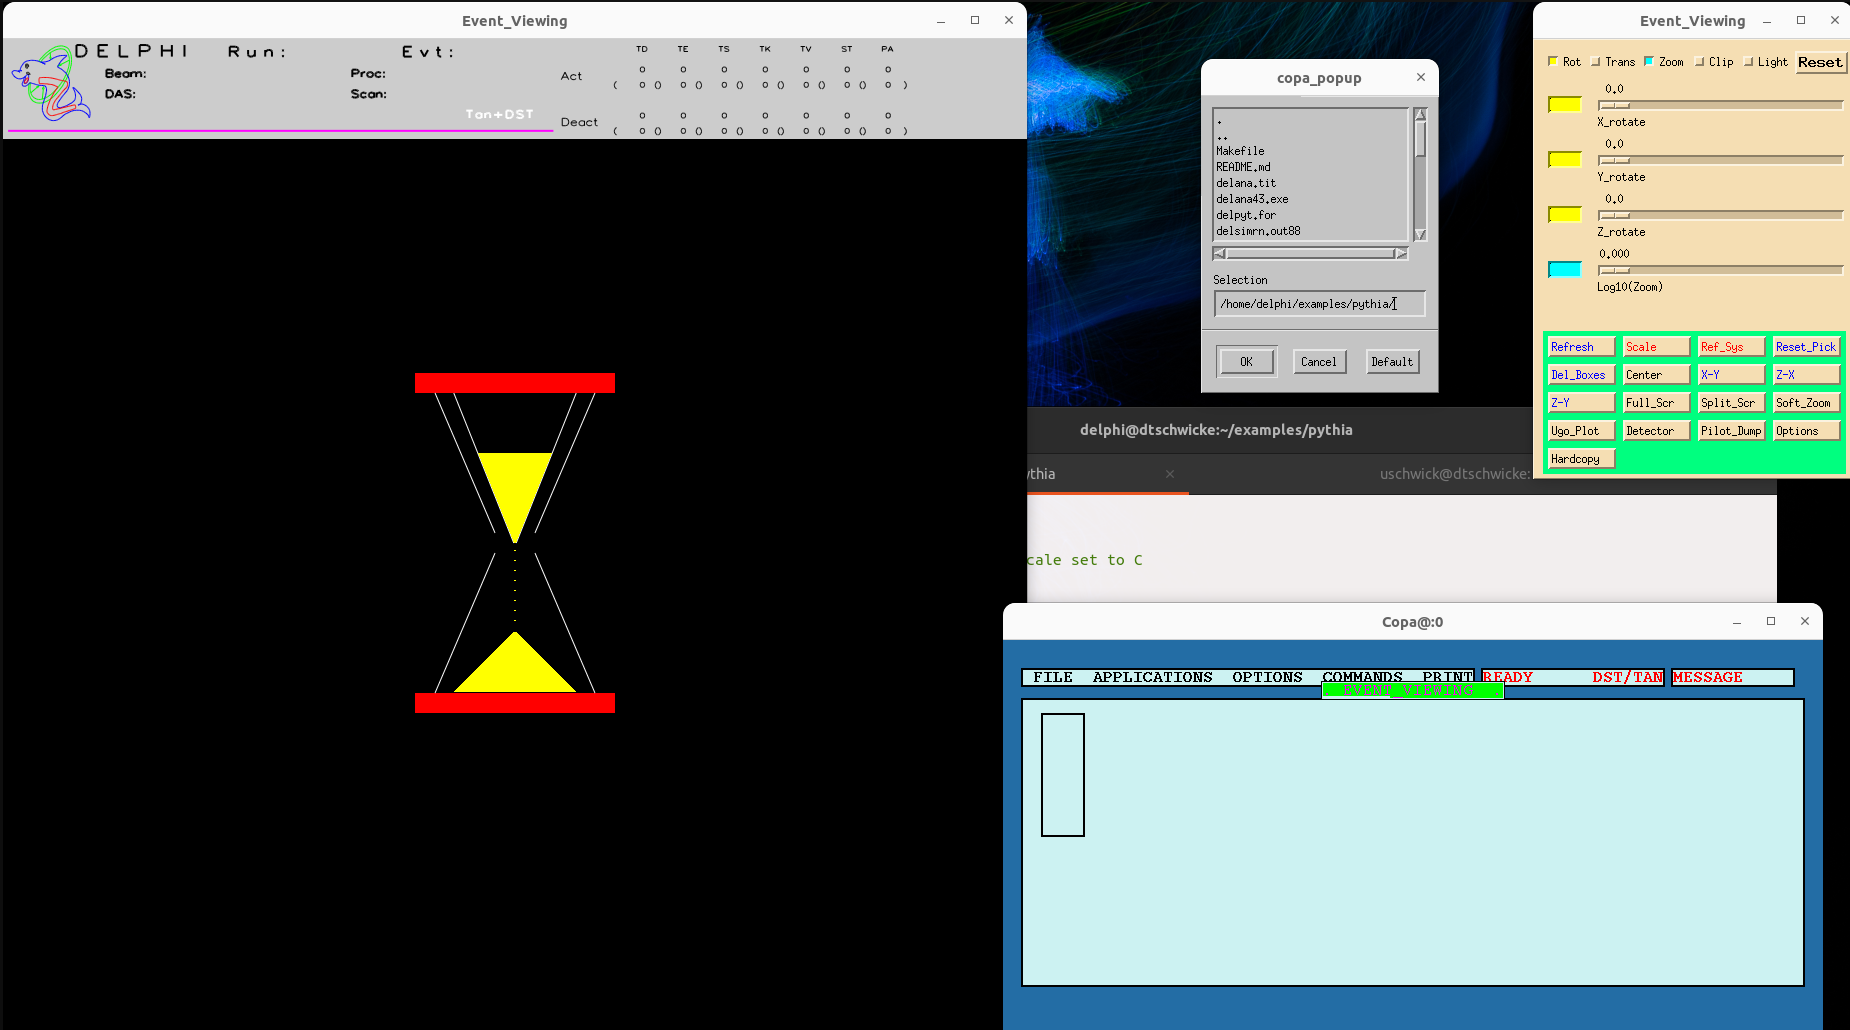
Change into the ~/graexe/data folder and select a suitable file. In the screenshot here, there is a file called simana.sdst. In the example shown here this is a short DST file of simulated data, which can be selected for viewing. Select the file of your choice, and press Ok in the dialog.
Next, the event display will ask for the event number in this run to be read:
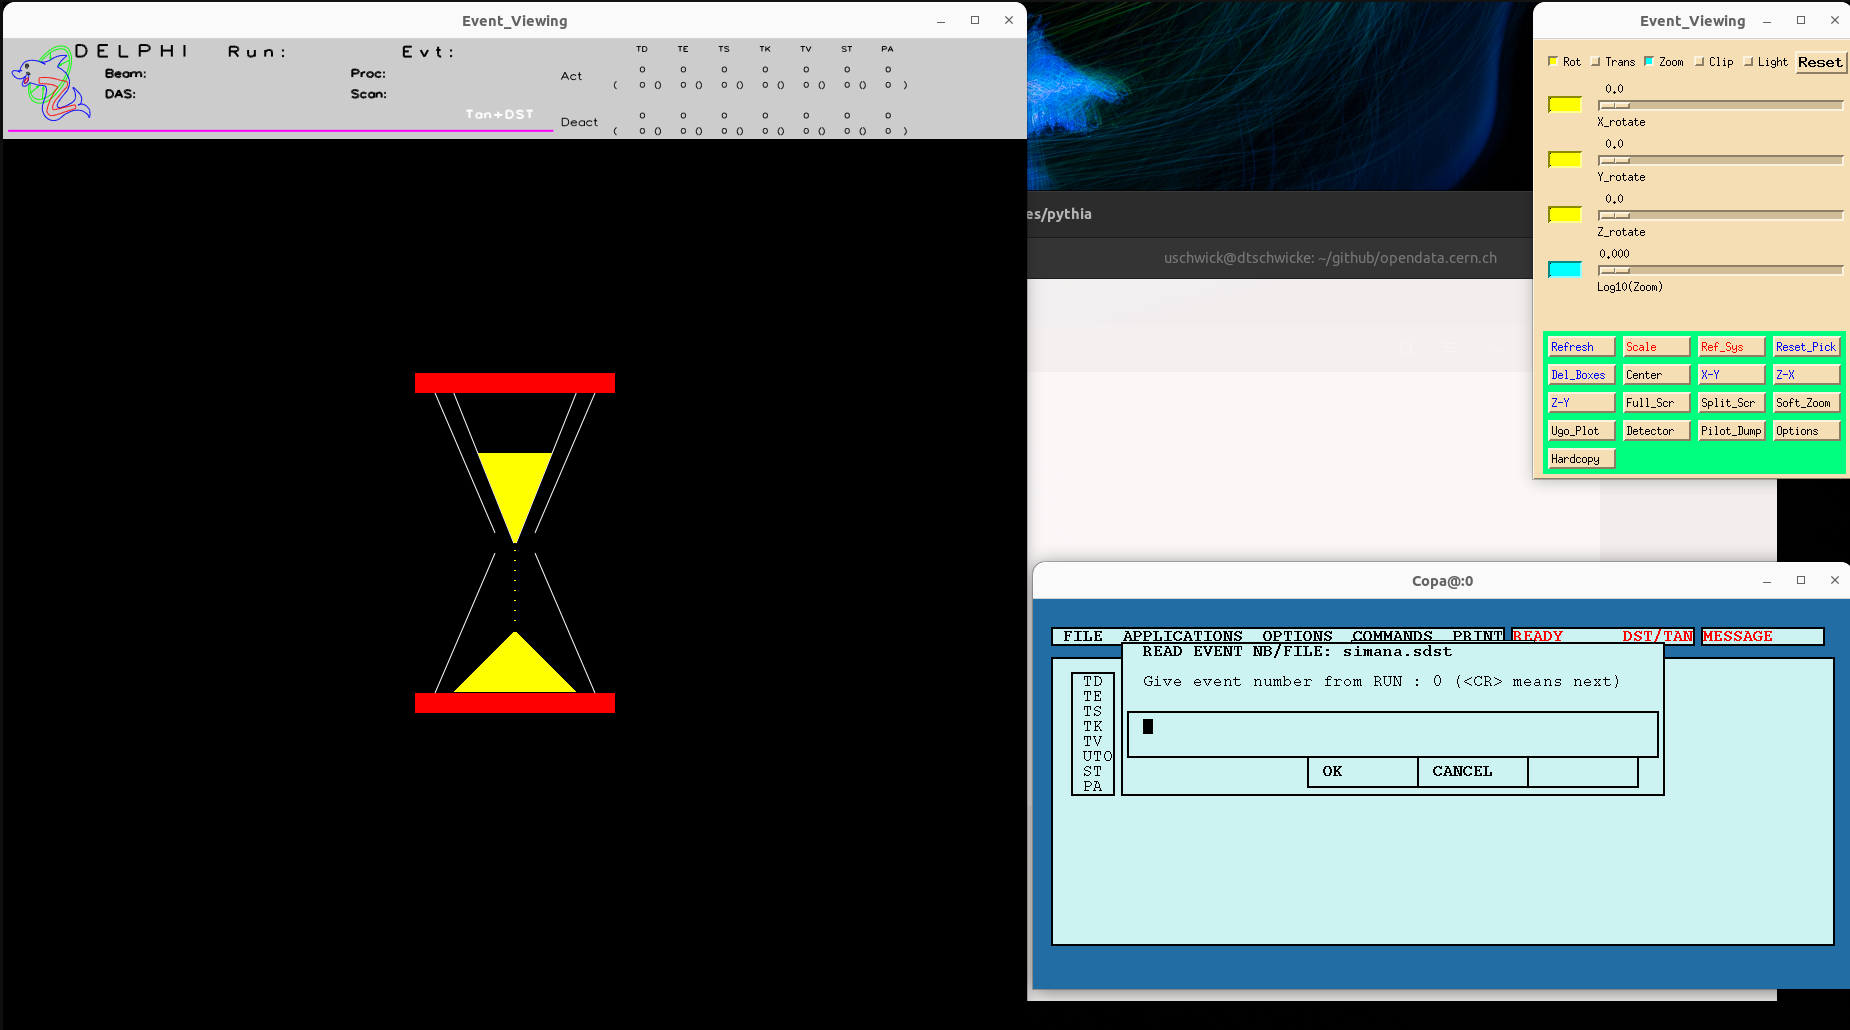
By just clicking OK or pressing the return key it will start reading the first event.
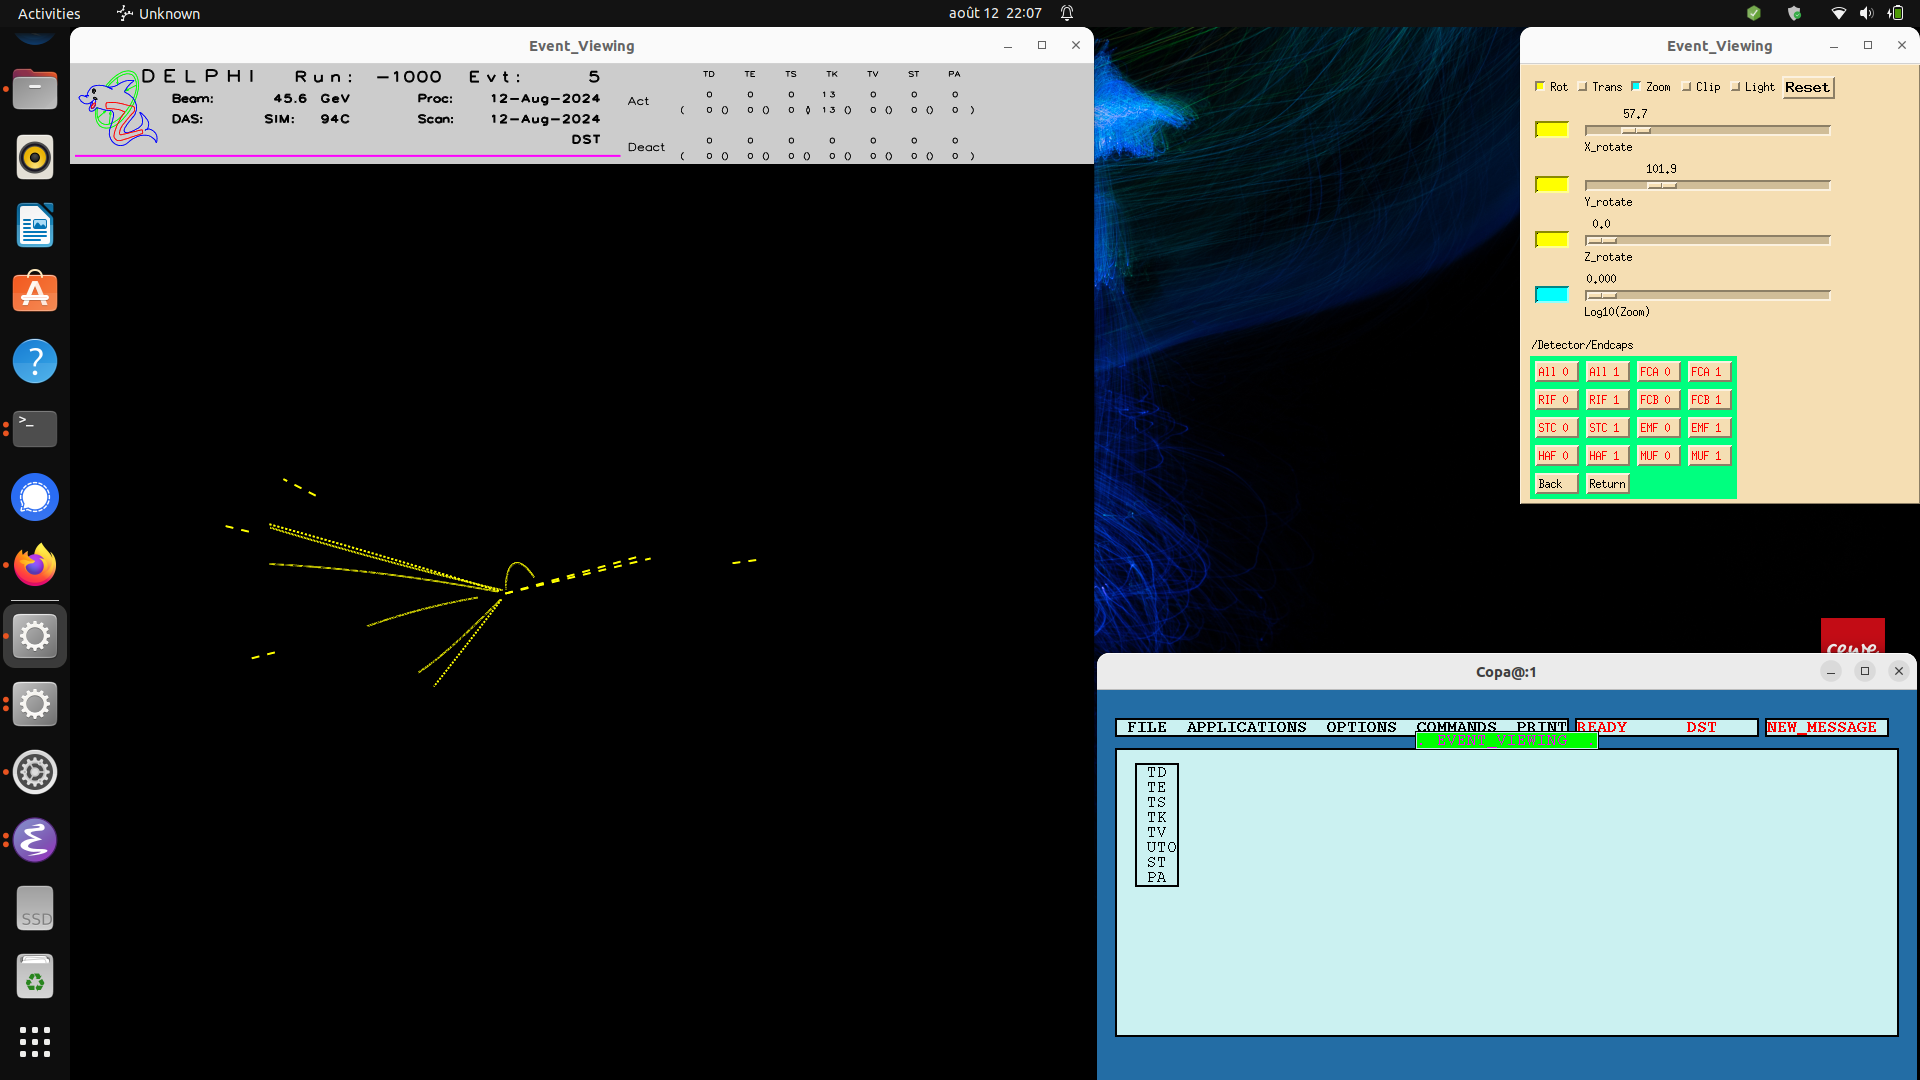
Now you can view it, rotate it, zoom in, and analyse it, or you can skip to the next event, going through them one by one. Here's a screen shot of event number 5 in our example file, viewed at a slightly different angle:
Event display manual
The event display manual can be found here